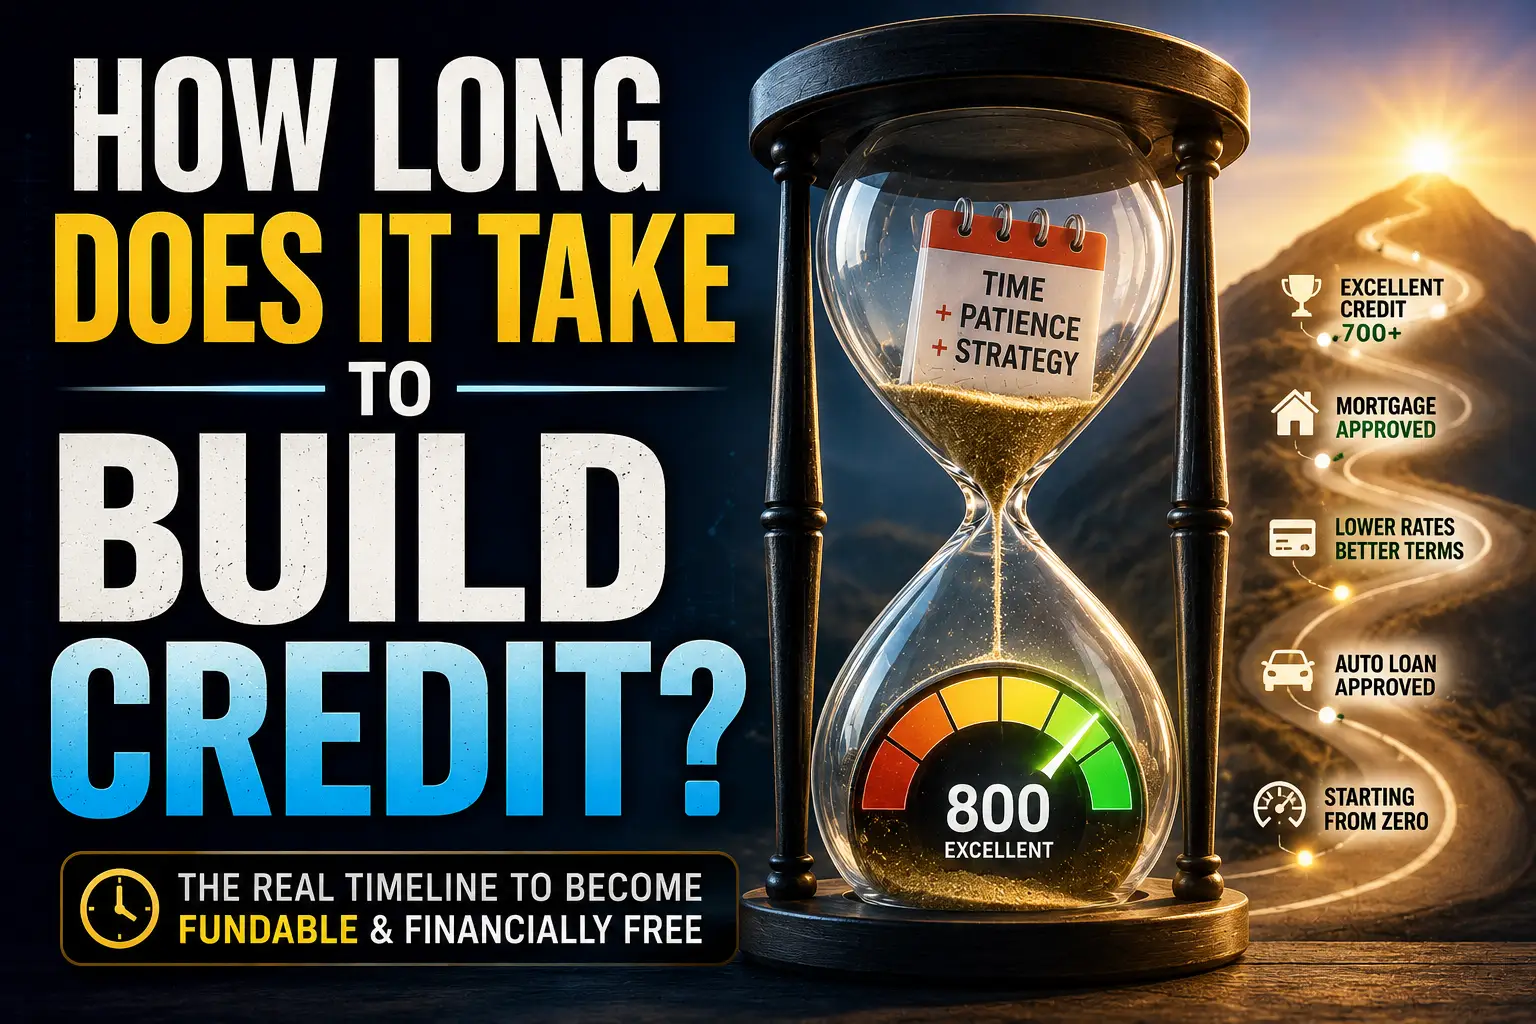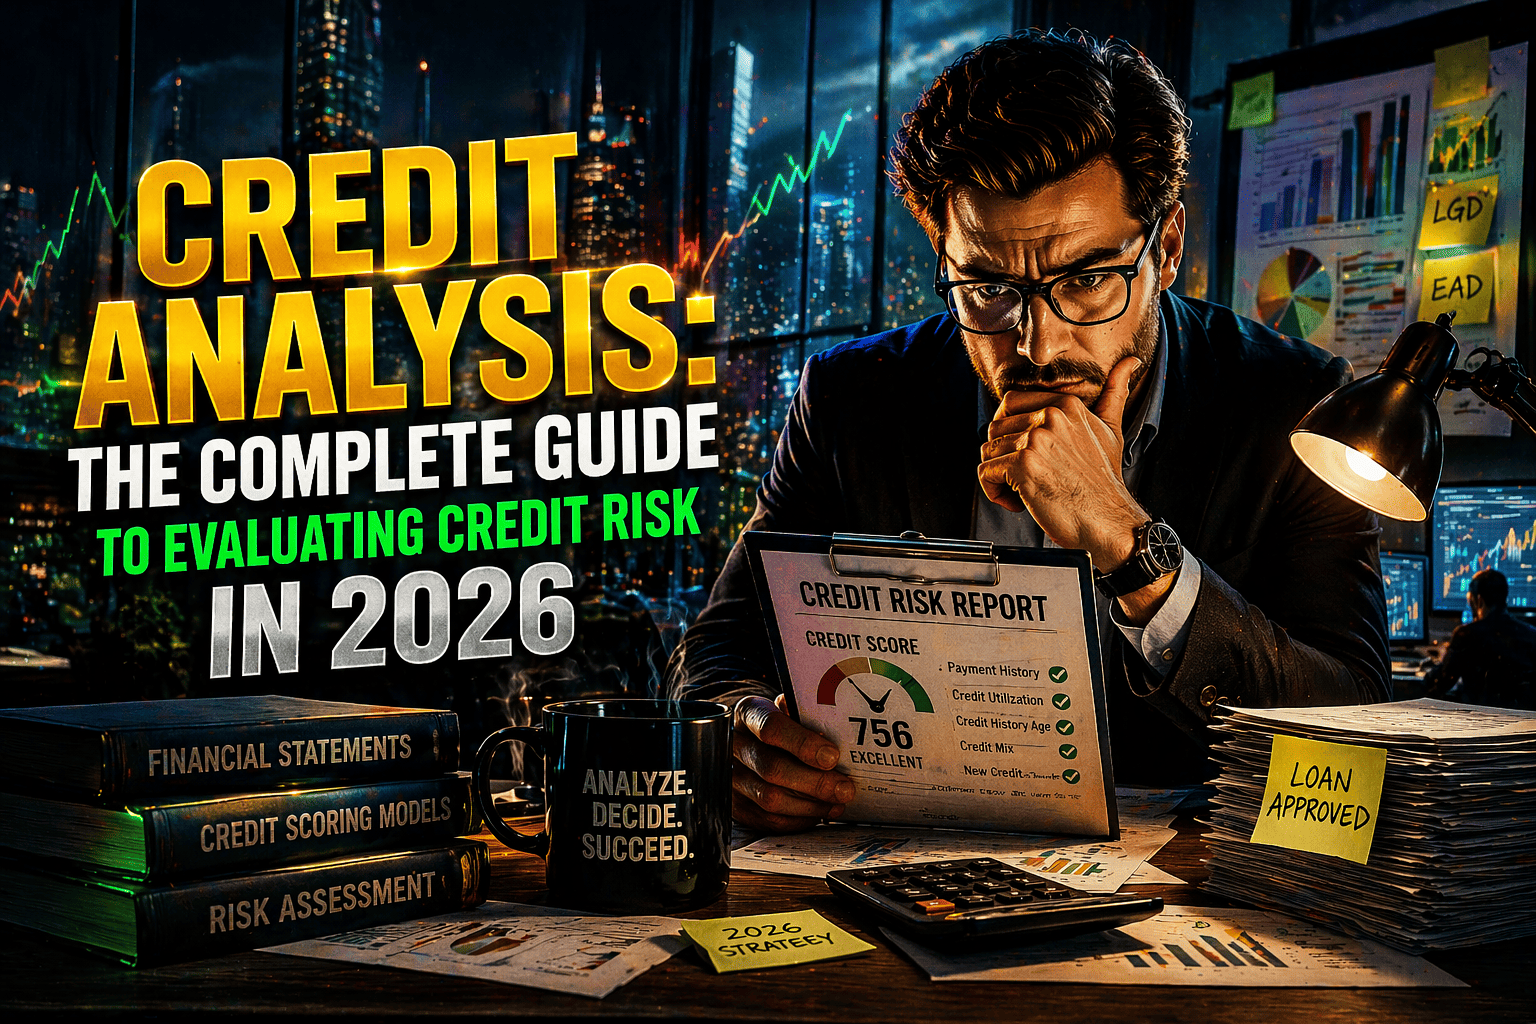
If you have ever wondered why one borrower gets approved quickly while another gets denied, priced higher, or asked for more documentation, the answer usually comes down to credit analysis.
Credit analysis is the process lenders use to evaluate how risky it is to extend credit to a person or business. That sounds simple on the surface, but in real lending environments, it is not just about one score. It is about how your full profile behaves under underwriting review: your payment history, debt load, credit utilization, recent inquiries, account mix, reserves, and the story your credit report tells as a whole.
In 2026, that process matters even more. The latest New York Fed household debt data shows total U.S. household debt reached $18.8 trillion at the end of 2025, while credit card balances rose to $1.28 trillion and auto loan balances to $1.67 trillion. At the same time, lenders have stayed highly focused on borrower quality, delinquencies, and pricing discipline. (Federal Reserve Bank of New York)
This guide explains what credit analysis really is, how lenders evaluate risk in 2026, what factors matter most, and how a borrower can improve profile positioning without relying on hype or bad advice.
What credit analysis means
At its core, credit analysis is a structured review of a borrower’s likelihood of repaying debt on time. The CFPB describes a credit score as a prediction of your credit behavior based on information in your credit reports, and lenders use that information to decide whether to offer credit and at what rate. (Consumer Financial Protection Bureau)
But lenders do not stop at the score.
A real credit analysis often includes:
Credit score review
Full credit report analysis
Debt-to-income ratio review
Credit utilization review
Payment history review
Recent inquiries and new accounts
Revolving vs. installment debt behavior
Capacity, stability, and overall risk modeling
Based on risk modeling trends, lenders want to know two things:
Can this borrower repay?
How likely is this borrower to become delinquent?
That is why credit analysis sits at the center of underwriting, lending criteria, and borrower risk profiling.
How lenders evaluate credit risk
Lenders usually analyze credit risk in layers, not in isolation.
1. Credit score
A credit score is a quick risk snapshot, but not the whole decision. CFPB explains that many scores range from 300 to 850, and a higher score generally makes it easier to qualify for loans and better pricing. Experian’s standard FICO-based ranges classify 670–739 as good, 740–799 as very good, and 800–850 as exceptional. CFPB’s 2026 borrower-risk segmentation also uses tiers such as deep subprime below 580, subprime 580–619, and near-prime 620–659. (Consumer Financial Protection Bureau)
That means a lender may see:
680+ as a stronger baseline for many mainstream approvals
620–679 as workable but more price-sensitive
Below 620 as higher risk, especially when combined with high utilization or recent delinquencies
2. Payment history
Payment history remains one of the strongest credit risk signals. MyFICO says payment history accounts for 35% of a FICO Score, and Equifax notes that payment history often has the most influence on credit scores. More severe, recent, and frequent delinquencies typically create more risk. (myFICO)
From an underwriting standpoint, one isolated late payment is not the same as a pattern of 30-, 60-, or 90-day delinquencies. A lender reads repeated late payments as behavior, not an accident.
3. Debt-to-income ratio (DTI)
The CFPB defines DTI as all monthly debt payments divided by gross monthly income. It is one of the clearest measures of repayment capacity. For general qualified mortgages, the CFPB notes a 43% DTI cap in the General QM framework. (Consumer Financial Protection Bureau)
In practice:
Under 35% often looks stronger
Around 36%–43% can still work depending on the product
Above 43%–50% starts to pressure approval odds
Above 50% usually puts a file into a clearly higher-risk posture
DTI does not directly change your FICO score, but it absolutely affects underwriting logic.
4. Credit utilization ratio
Experian explains that lower utilization is better, that below 30% is a common benchmark, and that people with the highest scores often have utilization in the single digits. (Experian)
This matters because high revolving utilization can signal stress, even if the borrower is still technically current.
A lender may interpret utilization like this:
1%–9%: very controlled
10%–29%: generally healthy
30%–49%: rising pressure
50%–69%: elevated risk
70%+: serious stress signal
5. Report depth and account mix
FICO also weighs amounts owed at 30%, length of history at 15%, new credit at 10%, and credit mix at 10%. That means a thin file, too many new accounts, or a file made up only of revolving debt can hurt risk positioning even when the score looks decent on the surface. (myFICO)
2026 lending reality: what has changed
The 2026 lending environment is not just about qualification. It is about pricing, documentation, and risk segmentation.
The Federal Reserve’s January 2026 Senior Loan Officer Opinion Survey showed banks still paying close attention to expected credit quality across categories in 2026. Meanwhile, New York Fed data showed overall household debt continued rising into late 2025, with aggregate delinquency at 4.8% in Q4 2025. (Federal Reserve)
That means lenders in 2026 are generally asking:
Is this borrower stable enough for the requested limit or loan amount?
Are high balances masking repayment stress?
Is recent behavior improving, flat, or deteriorating?
Does the file support prime pricing or only near-prime/subprime pricing?
Prime vs. subprime in practical terms
A simple 2026 framework looks like this:
| Risk Tier | Typical Profile Signals |
|---|---|
| Prime | 680+ score, low utilization, stable payment history, manageable DTI |
| Near-prime | 620–679 score, mixed utilization, moderate DTI, some recent stress |
| Subprime | 580–619 score, higher utilization, thinner repayment margins |
| Deep subprime | Below 580, heavier derogatories, high utilization, weak repayment profile |
This is a practical simplification, but it aligns well with CFPB’s borrower-risk ranges and mainstream underwriting logic. (Consumer Financial Protection Bureau)
Realistic 2026 APR context
APR is product-specific, but stronger credit still matters materially. CFPB’s mortgage rate tool showed that for a borrower with a 700 credit score, 30-year mortgage offers could range roughly from 5.875% to 8.125% depending on pricing and lender assumptions. Separately, Federal Reserve consumer-credit data shows commercial bank credit card rates on accounts assessed interest were still above 21% in early 2026, reflecting how expensive revolving debt remains even before penalty pricing or weaker-credit adjustments. (Consumer Financial Protection Bureau)
So in 2026, credit analysis affects more than approval. It affects APR, credit limits, reserves requirements, and deal structure.
Credit reporting mechanics: how this shows up on a report
A lender’s credit analysis is only as good as the data being reviewed.
Equifax explains that lenders usually report information to the credit bureaus monthly, and credit card issuers typically report around the billing-cycle date. That means utilization can spike or fall based on statement timing, not just on whether you paid during the month. (Equifax)
A credit report usually includes:
Tradelines and account types
Current balances and limits
Payment history
Derogatory marks
Inquiries
Public record-related items where applicable
Account status details and updates over time
Equifax notes that credit reports summarize account history, payment history, and limits, while CFPB explains credit scores are built from report data. (Equifax)
Why payment timing matters
A borrower may think, “I pay in full every month, so my utilization must be low.” Not necessarily.
If a lender reports your balance before your payment posts, your utilization could still appear elevated. That does not always mean you are overextended, but it can still affect scoring and risk interpretation that month.
Why compliance and accuracy matter
The FCRA requires consumer reporting agencies to follow reasonable procedures to assure the maximum possible accuracy of the information they report. That matters because underwriting decisions are often only as reliable as the underlying tradeline data. (Federal Trade Commission)
For a credit-analysis platform, this is where careful report review becomes important: not hype, but accurate interpretation of what is being reported, how it is being reported, and whether the file reflects the consumer’s actual risk profile.
Funding impact analysis
Here is the practical side of credit analysis: how the same borrower can look dramatically different under underwriting based on just a few variables.
| Factor | Low Risk | High Risk |
|---|---|---|
| Score | 680+ | Under 600 |
| DTI | Under 35% | Over 50% |
| Utilization | Under 30% | Over 70% |
| Payment History | Mostly clean | Recent or repeated late payments |
| Inquiries / New Accounts | Controlled | Aggressive recent activity |
Scenario A: stronger approval posture
705 score
24% utilization
33% DTI
No recent 60-day lates
Mixed revolving and installment history
This borrower may still be priced differently by product, but the file usually signals better control, lower stress, and more predictable repayment behavior.
Scenario B: weaker approval posture
598 score
81% utilization
52% DTI
Recent 30/60-day delinquencies
Multiple recent inquiries
This file does not just look weaker because of the score. It looks weaker because several risk factors stack together. That is how underwriting works in real lending environments: layered risk compounds.
Installment vs. revolving analysis
One thing many consumers miss is that lenders do not treat all debt the same.
Revolving debt
Credit cards and lines of credit can change month to month. High balances on revolving accounts usually create stronger risk signals because they show ongoing usage pressure and directly affect utilization.
Installment debt
Auto loans, student loans, and personal loans are typically more structured. They still affect DTI and payment history, but they do not create revolving-utilization pressure the same way credit cards do.
So if two borrowers both owe $20,000, the one with that amount spread across maxed-out credit cards often looks riskier than the one carrying a structured installment loan with clean payment history.
Common misconceptions about credit analysis
Myth 1: Credit analysis is just your credit score
False. Your score is a summary signal, not the full underwriting file.
Myth 2: Below 30% utilization is the finish line
Not exactly. Experian notes that single-digit utilization is often stronger than merely being under 30%. (Experian)
Myth 3: DTI does not matter if your score is high
False. A strong score can help, but if your repayment capacity is stretched, DTI can still weaken the deal.
Myth 4: Paying on time this month fixes everything immediately
Not always. Payment history, recent delinquencies, utilization timing, and account seasoning all affect how quickly a file improves.
Myth 5: More approvals always mean a stronger file
Actually, too many recent inquiries or new accounts can signal elevated credit-seeking behavior and make a file look more aggressive.
How to improve your credit analysis profile
If you want a lender to see a lower-risk borrower, focus on the factors that change the story of the file:
Lower revolving utilization before statement dates
Protect payment history at all costs
Reduce DTI where possible
Avoid unnecessary new applications
Review reports for data accuracy
Build stable account history over time
For broader context, this article should internally support your pillar content on credit risk evaluation and underwriting logic and related funding-readiness education.
FAQ
What is credit analysis in simple words?
Credit analysis is the process of reviewing a borrower’s credit profile to decide how risky it is to lend to them.
How do lenders evaluate credit risk?
They usually review score, payment history, utilization, DTI, report depth, recent inquiries, and overall repayment behavior. (Consumer Financial Protection Bureau)
Is a 680 credit score good in 2026?
For many mainstream lending situations, 680 is a stronger starting point than fair or subprime ranges. It is not the top tier, but it often places a borrower in a more favorable risk bucket than sub-620 credit. (Experian)
What utilization ratio is best?
Below 30% is a common benchmark, but lower is generally better, and single-digit utilization is often strongest for scoring models. (Experian)
Does DTI affect loan approval?
Yes. DTI is one of the clearest capacity measures in underwriting, and the CFPB’s General QM framework references a 43% DTI threshold for that mortgage category. (Consumer Financial Protection Bureau)
How often do credit reports update?
Usually monthly, but exact reporting dates vary by lender. (Equifax)
Why can a borrower with a decent score still get denied?
Because underwriting is broader than the score alone. High DTI, heavy utilization, recent delinquencies, unstable profile behavior, or aggressive recent credit activity can still weaken the file.
Author
Written by: Ali Badi
Title: CEO / Credit Risk Strategist / Funding Analyst
Experience: 5 years / credit analysis
Ali Badi writes on credit analysis, underwriting logic, funding readiness, and consumer credit-report interpretation with a focus on practical borrower-risk evaluation. His work is centered on helping users understand how lending decisions are made, how credit-report data affects profile strength, and how to interpret risk factors without hype or misleading approval claims.
Disclaimer
This article is for educational purposes only and does not constitute financial, lending, or legal advice.
Sources used
CFPB
Federal Reserve / Federal Reserve Bank of New York
Experian
Equifax
FTC